Application definition for stress and strain analysis of crystalline material de ...
Application definition for stress and strain analysis of crystalline material defined by the EASI-STRESS consortium.
When a crystal is loaded (applied or residual stress) its crystallographic parameters change.
Stress and strain analysis calculates deformation (strain) and the associated force (stress)
from diffraction data.
This application definition essentially standardizes the result of diffraction pattern analysis
from different types of diffraction experiments for the purpose of stress and strain analysis.
The analysis is typically some form of diffraction peak indexing and fitting.
The experiments are for example
energy-dispersive X-ray powder diffraction
angular-dispersive X-ray powder diffraction
angular-dispersive neutron powder diffraction
time-of-flight (TOF) neutron powder diffraction.
In addition, the application definition guarantees that the information about instrumental setups, measurement conditions, and data analysis workflows are described.
This ensures not only the reproducability and tracability of the measured data, but also the meta-data. Since not all participating beamlines or instruments can provide an input to all the NXfields listed in this application definition, not all of them are “required”.
However, when possible and technically feasible, the instrument using the NXstress application definition is expected to provide the type of information outlined below.
Sample and detector positions can be defined with NXtransformations. If you don’t specify the direction of gravity
and the direction of the beam then the standard NeXus Coordinate System is used.
It is highly recommended that in case certain parameters or values are the same for all the measurements (acquistions) in the same
file, that they are stored only in one location and then linked in the other instances. For example, if during an acquisition all
instrumental parameters but one stay the same and only the sample table moves in one direction (e.g. Xtranslation), then all the
static instrumental parameters should be saved just once (e.g. in just one NXentry or in a Shared_Information group) and their
vales linked to every instrument group under all the other acquistions. The value for the variable that changes, Xtranslation
in this example, is suggested to only be saved at every instrument group under each acquistion but not in the Shared_Information group.
It is not always necessary to link each field. In case all the fields with an entire group are the same, the entire group can be linked.
Symbols:
nX: Number of diffractogram channels.
nD: Number of diffractograms. For example the number of energy-dispersive detectors or the number of azimuthal sections in an area detector.
nPeaks: Number of reflections.
xUnit: Diffractogram X units.
yUnit: Diffractogram Y units.
cUnit: Converted diffractogram X units (could be the same as xUnit).
The name of the NXentry group(s) can be freely chosen by the facility. The NXentry group can contain any form of data acquisition (e.g. a measurement point, multiple measurement points, a line scan, a mesh, all data points from one sample …).
Unique identifier for the experiment as defined by the facility (e.g. DOI, proposal id, …). At ILL, this could be, for example, exp_1-02-286, exp_INDU-229, or exp_INTER-569.
User or Data Acquisition defined identifier from which ...
User or Data Acquisition defined identifier from which
the content of this application definition is derived. This can be freely chosen by the user or the instrument scientist and could be, for example, 05_DA_650_AX_B3P5, SENB-14, Quartz,….
Brief summary of the collection, including grouping criteria. The information provided in this field can highlight, for example, the measurement setup or information about experimental conditions.
This variable describes the type of data plotted in the diffractogram and de ...
This variable describes the type of data plotted in the diffractogram and describes the type of calculation used in the EASI-STRESS software. Any of these values are valid:
Name of the diffractometer, instrument, or beamline used for the experiment. This could be, for example, Strain Analyser for Large and Small scale engineering Applications.
Source energy. The energy should be provided in keV, but if chosen other ...
Source energy. The energy should be provided in keV, but if chosen otherwise, the units must be clearly specified. For storage rings, this would be the particle beam energy.
For X-ray tubes, this would be the excitation voltage. In case of energy dispersive diffraction, the
In case of monochromatic radiation, the wavelength used during the experiment. The wavelength should be provided in \(\unicode{x212B}\), but if chosen otherwise, the units must be clearly specified.
Description of type such as 3He gas cylinder, 3He PSD, scintillator, fission chamber, proportion counter, ion chamber, CCD, pixel, image plate, CMOS, …
This is the distance to the previous component in the ...
This is the distance to the previous component in the
instrument; most often the sample. The usage depends on the
nature of the detector: Most often it is the distance of the
detector assembly. But there are irregular detectors. In this
case the distance must be specified for each detector pixel.
1. For a pixel detector it provides the nominal wavelength
for which the detector has been calibrated.
2. For other detectors this field has to be seen together with
the efficiency field above.
For some detectors, the efficiency is wavelength dependent.
Thus this field provides the wavelength axis for the efficiency field.
In this use case, the efficiency and wavelength arrays must
have the same dimensionality.
The axis on which the detector position depends may be stored ...
The axis on which the detector position depends may be stored
anywhere, but is normally stored in the NXtransformations
group within the NXdetector group.
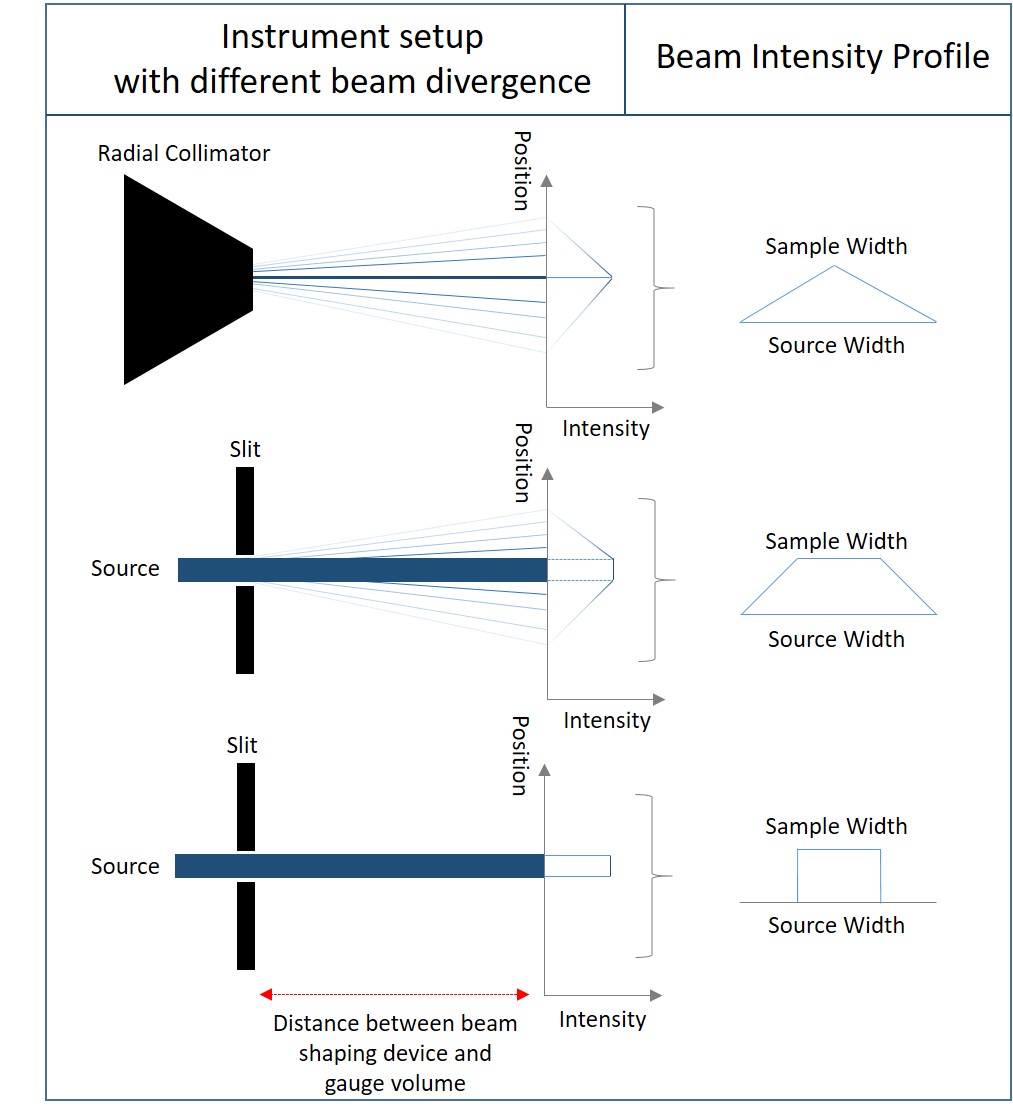
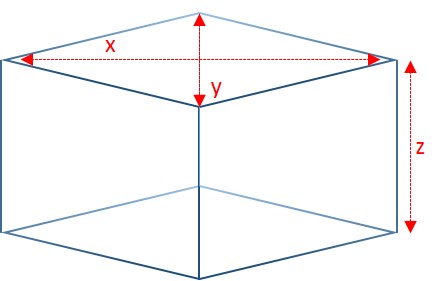
Defines the dimensions of the beam profile used for probing the sample whi ...
Defines the dimensions of the beam profile used for probing the sample which corresponds to or can be used to determine the instrumental gauge volume.
A description of the subsequent fields can be found in the folowing figure. The term “primary” in the subsequent fields refers to the beam path between the sample and the source. The term “secondary” refers to the beam path between the sample and the detector(s).
Some examples for the beam intensity profile. The 1D description of the beam profile on the right can equally be applied for the horizontal and vertical direction for the primary and the secondary side.
Describes how the beam intensity profile in the primary vertical direction was determined. Examples of valid entries are: measured, theoretical, estimated, …
Describes how the beam intensity profile in the primary horizontal direction was determined. Examples of valid entries are: measured, theoretical, estimated, …
Describes how the beam intensity profile in the secondary horizontal direction was determined. Examples of valid entries are: measured, theoretical, estimated, …
The chemical formula specified using CIF conventions. ...
The chemical formula specified using CIF conventions.
Abbreviated version of CIF standard:
Only recognized element symbols may be used.
Each element symbol is followed by a ‘count’ number. A count of ‘1’ may be omitted.
A space or parenthesis must separate each cluster of (element symbol + count).
Where a group of elements is enclosed in parentheses, the multiplier for the
group must follow the closing parentheses. That is, all element and group
multipliers are assumed to be printed as subscripted numbers.
Unless the elements are ordered in a manner that corresponds to their chemical
structure, the order of the elements within any group or moiety depends on
whether or not carbon is present.
If carbon is present, the order should be:
C, then H, then the other elements in alphabetical order of their symbol.
If carbon is not present, the elements are listed purely in alphabetic order of their symbol.
This is the Hill system used by Chemical Abstracts.
The note will contain information about how the data was processed ...
The note will contain information about how the data was processed
or anything about the data provenance.
The contents of the note can be anything that the processing code
can understand, or a simple text.
The name will be numbered to allow for ordering of steps.
This group contains all diffraction peak fit parameters. ...
This group contains all diffraction peak fit parameters.
This information is not required for stress and strain calculations.
Note that as in any NXdata group, each field can have uncertainties
associated to them (e.g. center_errors would be the uncertainties
on the peak center).
Angle that define the position of the integrated sector in the diffracti ...
Angle that define the position of the integrated sector in the diffraction cone
for angular-dispersive diffraction or the position of the detector for energy-dispersive
diffraction.
shapefunctionpluspolynomial : A shape function is not a mathematical function, it contains a manual background obtained from a fit and a polynomial part. This allows to adapt and modify the fit for subsequent measurements in the same measurement campaign. The function describing it is the following: \(\small background= as + b \cdot SHAPE(x-o)\) Where SHAPE is the name of the variable used to describe the background value at the position x. x can be e.g. the scattering angle \(2\theta\) in degrees.
Confidence interval from which the background counts are integrated. ...
Confidence interval from which the background counts are integrated.
For example 0.95 means that the background is integrated over the range in
which the integrated peak area is 95% of the total peak area.
One or more fields that contain the values for the **nD** dimension. ...
One or more fields that contain the values for the nD dimension.
For example the azimuthal positions of different energy-dispersive detectors
or the average azimuth of different azimuthal sections on an area detector.
One or more fields that contain the values for the **nX** dimension in * ...
One or more fields that contain the values for the nX dimension in xUnit units.
For example: MCA channels, scattering angle \(2\theta\) in degrees,
scattering vector length q in \(\mathrm{nm}^{-1}\), …
This group contains all diffraction peak parameters that could be needed for ...
This group contains all diffraction peak parameters that could be needed for stress and strain calculations.
These parameters are derived from peak_parameters and additional metadata.
First component of the *normalized* scattering vector *Q* in the sample re ...
First component of the normalized scattering vector Q in the sample reference frame.
The sample reference frame is defined by the sample transformations.
Second component of the *normalized* scattering vector *Q* in the sample r ...
Second component of the normalized scattering vector Q in the sample reference frame.
The sample reference frame is defined by the sample transformations.
Third component of the *normalized* scattering vector *Q* in the sample re ...
Third component of the normalized scattering vector Q in the sample reference frame.
The sample reference frame is defined by the sample transformations.